
Climate Controller
Climate Controller was a solo game I developed as part of a module where we focused on our design process and discover what more niche areas of design that we would like to continue to pursue in the Final Year of University.
I chose to focus on Systems Design, specifically focusing around how I could translate the information present within the game to the player without overwhelming them and reducing the need to read external sources to understand game mechanics.
I chose to make an RTS game around controlling the amount of energy present within a given region, keeping the populous happy with enough energy and reducing any side effects that would arise from certain Power Production types. This then needs to be kept up throughout all regions until the technological progress of the planet is able to use 100% of energy resources available on the planet.
Github
Blender
C#
Unity
Photoshop
Documentation

Project Overview

Project Details
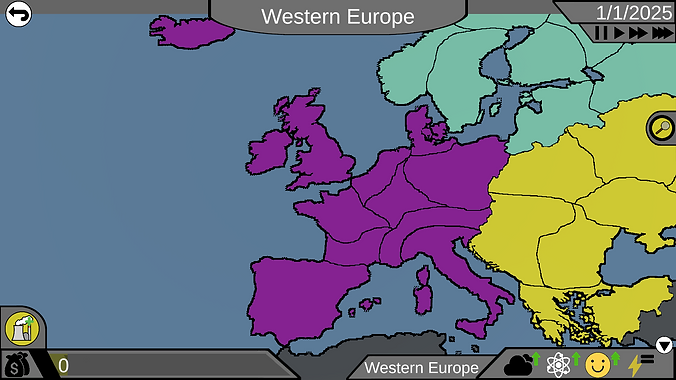
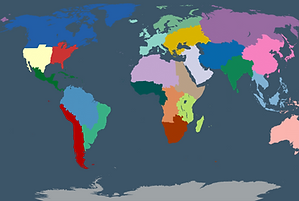
Regions
World Split
To help separate Information, the planet is split into regions.
This is to group similar geographic areas together and average out the population density.
Each region has their own group of stats and all have to stay about a certain threshold to avoid a loss.
Sub-Regions
Each region is split into sub-regions, these sub-regions then have their own stats and are more split based on population density.
This is where power plants can be placed with Region Stats being the average of all sub-regions.

region stats
Regions stats are more simplified compared to sub-regions, only having the average happiness, energy and science output.
This then gives the player to overview of the region, allowing them to monitor from afar.

Sub-region stats
Sub-Regions are where the player has direct influence, through the use of Power Plants.
Sub-Regions have preset stats that are related to the real world stats of the location.
These stats can then be viewed in the expanded view.

